XSL / XSLT Debugger
Oxygen XSLT Debugger helps you spot possible
bugs in your XSL stylesheets using the most common XSLT transformation engines, Saxon and Xalan.
XPath dynamic evaluation, step into XPath expressions, templates, and node stacks are just part of the information presented in the debugging perspective.
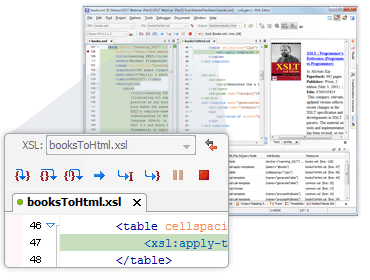
- XSLT Debugging PerspectiveOxygen provides a special layout for the debugging mode. It displays the XML source and the XSLT stylesheet side by side, and also offers dedicated XSLT debugging views and toolbars.read more
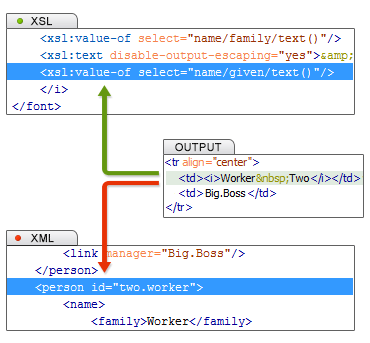 Debugging XSLT StylesheetsOxygen offers XSLT debugging support based on the most commonly used XSLT processors, Xalan and Saxon. The debugging configuration can be re-used through debugging scenarios.read more
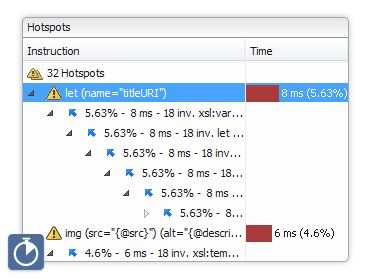 Performance Profiling of XSLT StylesheetUsing the XSLT profiler feature is essential to helping you to save time identifying performance issues, ensuring that the XSLT transformation is more scalable and performs better.read more
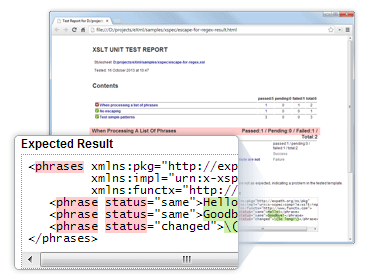
- XSLT Unit TestingOxygen provides XSLT unit testing support based on XSpec. You can easily create a test case scenario for XSLT stylesheets.read more