XQuery Debugger
XQuery Debugging Perspective
Save time when developing complicated XQuery expressions by using the Oxygen XQuery debugger. Oxygen can debug and profile expressions run over MarkLogic or Berkeley XML databases, or using the Saxon EE processors.
Oxygen provides a special layout when entering in debugging mode to show the XML source (optional) and the XQuery documents side by side and to also show the result and special XQuery debugging views and toolbars. The perspective allows you to use the common XML and XQuery editor features.
The XQuery debugger support is based on the Saxon EE XQuery processor that is bundled with Oxygen.
Full Control over the XQuery Debugging Process
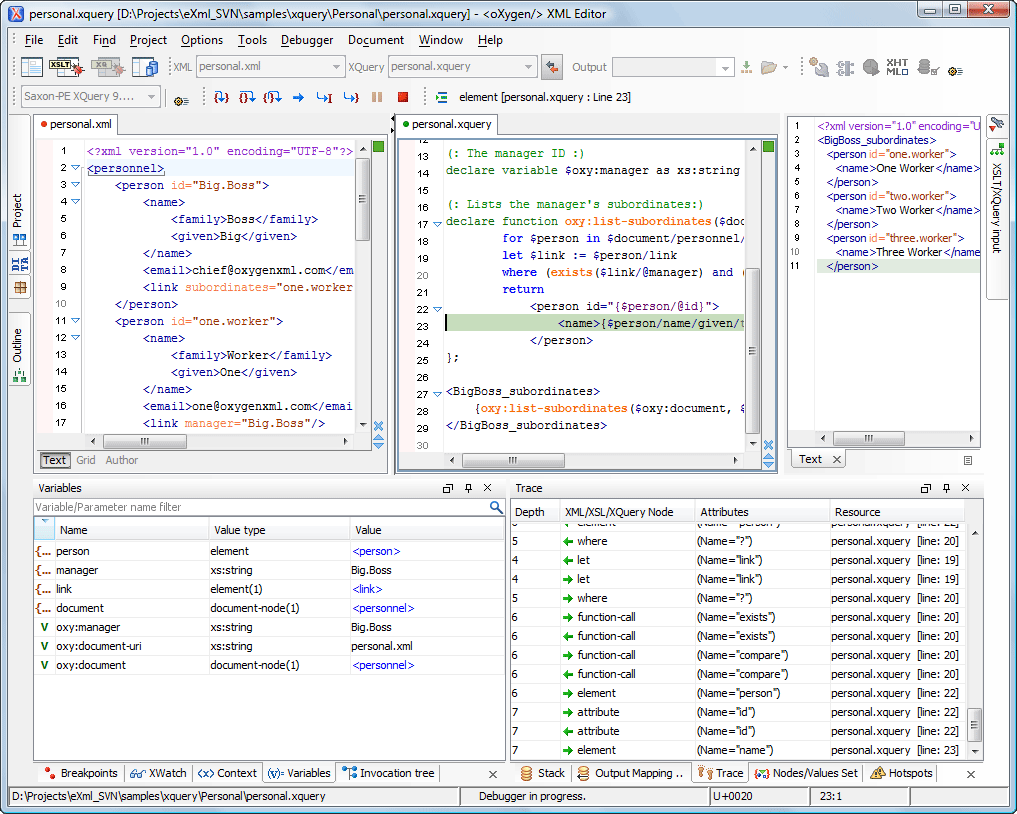
Oxygen provides all the usual debugging capabilities: step into, step over, step out, run, run to cursor, run to end, pause, stop. The current XML and XQuery nodes reached by the debugging process are shown (see the right part in the image that follows) with the following details: an arrow icon to show the action performed on it (entering/leaving), the name, the resource, and the line. By clicking the arrow, the text sections corresponding to the XML and XQuery nodes are highlighted in the editor.
Output Result is Linked to the Generated XQuery Element
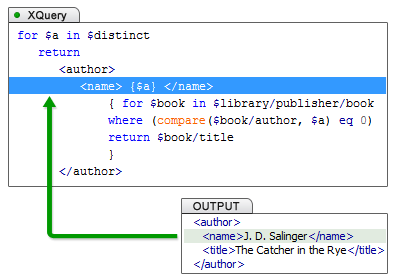
Allows you to easily find out what element from the XQuery document generated a section of the output. To do this, you just have to click on the Output text view. The editor will highlight the line in the XQuery document that generated the output.
The following image shows the right part of the debugging perspective, with the XQuery source in the left and the output in the right. The "<name>J. D. Salinger</name>" fragment of the output was generated by the highlighted name element of the input XQuery file.
Pause the Debugger Execution with Breakpoints
Breakpoints can be set on the XQuery document used in the transformation to pause the debugger. The breakpoints appear in the left bar of the XQuery editor, as a red dot, and they can be created easily by using the shortcut key or by clicking the breakpoints area.
Conditional Breakpoints
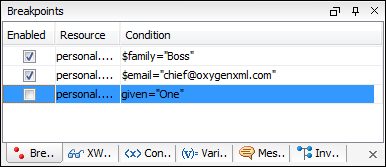
A condition can be attached to a breakpoint set in the Debugger perspective so that processing stops only if the condition is true.
XQuery Call Stack View
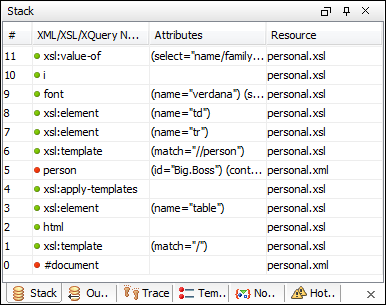
The current stack containing XQuery instructions can be inspected at any time during the debugging process. The Stack view shows the sequence of XQuery instructions currently executed by the debugger.
Trace History View
Entering and leaving node events are logged and made available in a view to show the history of the processor execution. You can click the entries in the list to see the corresponding instructions highlighted in the editor associated with the XQuery file where the instruction is defined.
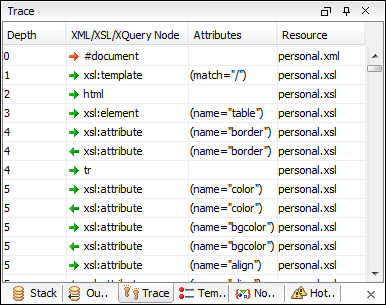
Save the Debug Trace
It is possible to save the element trace obtained from a debugging session as XML. This permits the comparison of multiple debug runs.
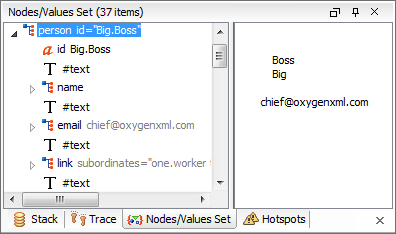
Tree View for Presenting Node Set Values
The current context node value or the values of variables that are evaluated to tree fragment or list of nodes are presented in tree-like views, thus giving you access to the whole variable content. This is useful especially in debugging XQuery transformations that keep intermediary results in variables.
The user can easily locate the nodes from the tree by simply clicking on them and the editor will select the corresponding XQuery instruction.
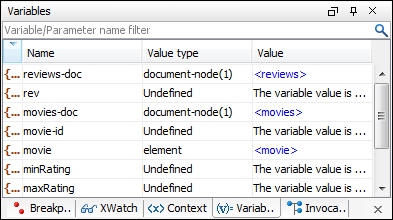
XQuery Variables View
The debugger lists all XQuery variables and parameters that are visible in the current XQuery context along with their scope and actual value. The view is updated as the XQuery processor changes the context during the transformation.
Dynamic XQuery Output Generation
The output is dynamically presented as it is generated by the XQuery transformation process. The user can directly examine the output as XML source.
Scenario-Based XQuery Debugging Session
Oxygen has powerful transformation support based on reusable scenarios. The same scenarios can be used for debugging. The XQuery Debugger will be initialized with the information from the XQuery scenario (source document location, transformation parameters) when the Debug scenario action is executed. This allows you to easily manage and trigger debugging sessions.
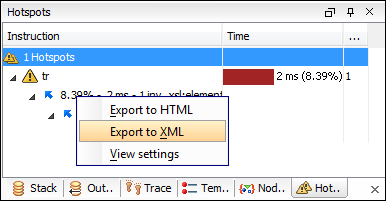
XQuery Profiler
You can profile your XQuery queries to identify the performance issues by using two comprehensive data views of the activated templates: an Invocation Tree view and a Hotspots view. The profiling information can be saved to XML or HTML formats.
Profiling is available only for the Saxon XQuery processor that is bundled with Oxygen.
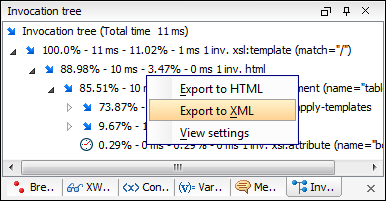
Invocation Tree View
Using the Invocation Tree view, also named a call tree, you can examine how XQuery instructions are processed in a top down manner. The profiling result shows the duration time for each of the style instruction, including the time needed for its children. Then, when an instruction is expanded, you can see how the instruction time is composed from child instruction times.
Hotspots View
Using the profiler Hotspots view you can immediately detect the time the processor spent in each instruction. The hotspot displays the inherent time of the instruction (the total time of processing that instruction minus the time for processing its children instructions). When a hotspot is expanded, you can see all the paths that instruction was called from (a reverse invocation tree), the number of invocations, the instruction time on that path, and the percentage from the instruction total execution that path contributes.