Usage Statistics Page
Users with a role of organization Owner or Admin have access to a Usage Statistics page where they can see the number of page views and comments added for all of the site configurations attached to the current organization.
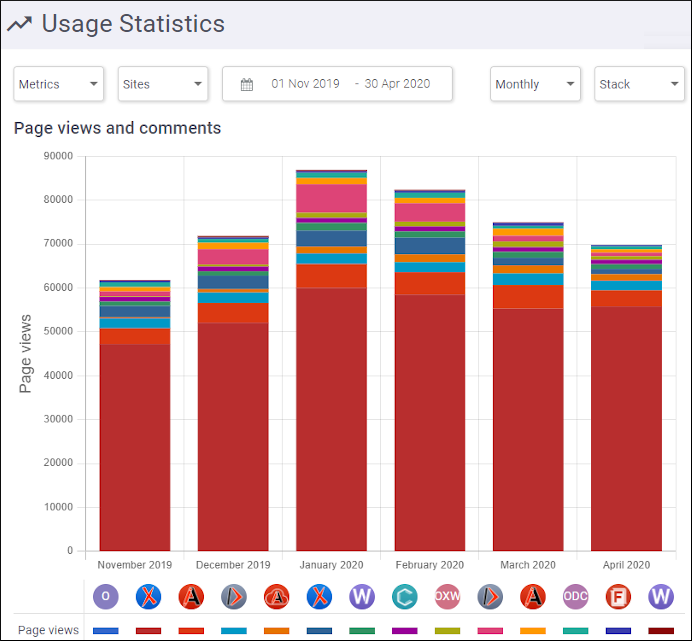
The top half of the page displays statistics for page views and/or comments in a graph form according to the selected filtering options.
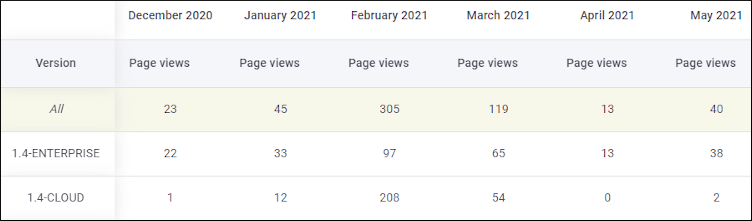
You can click the up or down arrow to the right of the title for each column header to sort that particular column. If you click the name of the site configuration, you will be directed to that particular site configuration. By default, the table is sorted in the descending order of the number of page views from the last column of the table (last month or last day of the selected period). You can click the arrow to the left of the site configuration name in the first column to expand the particular site configuration to show its configured versions. By default, the versions are sorted chronologically in this table.
At the top of the usage statistics page, there are some filtering options for the graphs:
- Metrics
- You can select the type of metric to be displayed. You can choose between Page views, Comments, or both.
- Sites
-
You can choose which site configurations to have their statistics displayed.
- Date Chooser
- You can select the time period to be displayed. You can choose a relative period (current month, last week, last month, last 3 months, last 6 months, and last year) or you can select a custom period. The default time period is automatically selected based upon the amount of data that is found in each month.
- Aggregate Chooser
- You can choose between Daily or Monthly for the type of aggregation to be displayed.
- Chart Type Chooser
-
You can select the type of the chart to be displayed. You can choose between Line, Bar, and Stack.