Hotspots View
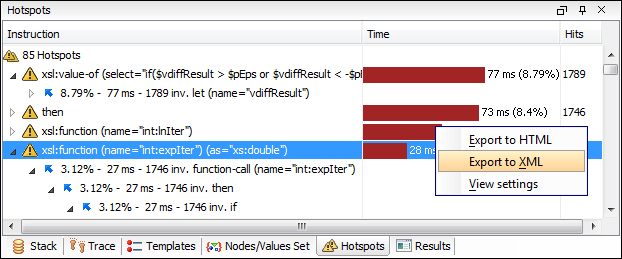
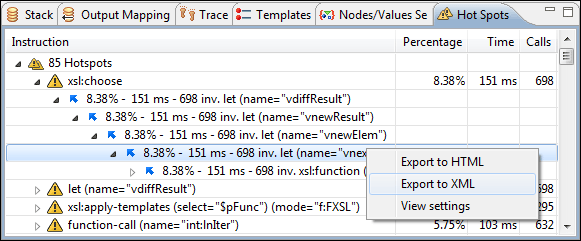
The Hotspots view displays a list of all instruction calls that lie above the threshold defined in the XSLT/XQuery profiler settings.


By opening a hotspot instruction entry, the tree of back-traces leading to that instruction call are calculated and shown.
Every hotspot is described by the values from the following columns:
- Instruction - The name of the instruction.
- Percentage - The percentage number for this hotspot entry with respect to the total time.
- Time - The inherent time in milliseconds or microseconds of how much time has been spent in the hotspot, along with a bar whose length is proportional to this value. All calls into this instruction are summed up regardless of the particular call sequence.
- HitsCalls - The invocation count of the hotspot entry.
If you click the  handle on the left side of a hotspot, a tree of back-traces will be
shown.
Every entry in the backtrace tree has textual information attached to it that depends on the XSLT/XQuery profiler settings:
- A percentage number that is calculated with respect to either the total time or the called instruction.
- A time measured in milliseconds or microseconds of how much time has been contributed to the parent hotspot on this call-path.
- An invocation count that shows how often the hotspot has been invoked on this
call-path.Note:This is not the number of invocations of this instruction.
- An instruction name that also contains its attributes.
The Hotspots view also includes the following contextual menu
actions:
