Debugging XSLT Stylesheets
Multiple XSLT Engine Support
Our XSLT debugger is bundled with the Saxon 6.5, Saxon EE, and Xalan 2.7 transformation engines. Selecting the processor is very simple and just involves changing the selection in the XSLT processor combo box. Although the processors are very similar, sometimes they produce different output for the same input, so it is best to test your XSLT stylesheets using the same processor type you are using in production.
Scenario-Based XSLT Debugging Session
Oxygen offers powerful transformation support based on re-usable scenarios. The same scenarios can be used for debugging. The XSLT Debugger is initialized with the information from the scenario (source or stylesheet location, XSLT processor, transformation parameters) when the debug scenario action is executed. This allows you to easily manage and trigger debugging sessions.
Output Result is Linked to the Generated XSLT Element
This feature allows you to easily find out what element from the XSLT stylesheet generated a section of the output. To do this, just click on the output text, either in the plain text result panel or in the XHTML preview panel. The editor will highlight the line in the stylesheet that generated the output. This allows you to immediately find out which XSLT template did not execute properly.
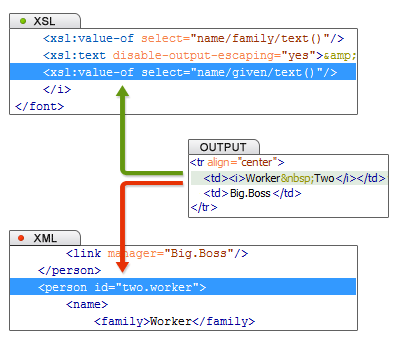
The following image shows a diagram of the debugging process, with the XSL source at the top, the XML at the bottom, and the output in the middle. The Worker string was generated by the xsl:value-of element, with the person element as the XML context node.
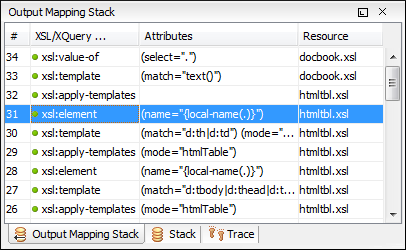
With complex transformations, inspecting the entire stack of XSLT templates that were active at the time the output fragment was generated speeds up the debugging process. Just enable the Output to Source Mapping option on the debugger toolbar and click an area of the output text to see the template stack in the Output Mapping Stack view.
Pause the Debugger Execution with Breakpoints
Breakpoints can be set on both XML or XSLT documents used in the transformation. The breakpoints appear in the left bar of the XML and XSLT editors, as a red dot, and can be created easily by using a shortcut key, or by clicking the breakpoints area.
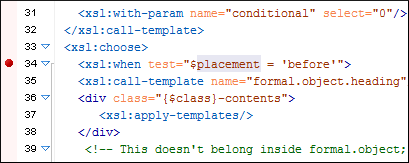
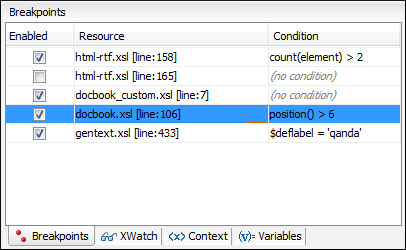
A condition can be attached to a breakpoint set in the debugger perspective. The XSLT debugger will stop only if the condition evaluates as true. If there is no associated condition, the debugger will always stop at the breakpoint line.
Output Generation
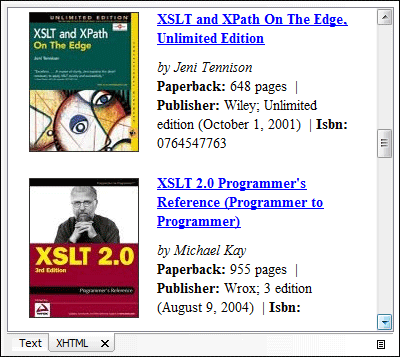
The output is dynamically presented as it is generated by the XSLT transformation process. The user can directly examine the output as XML source or rendered as XHTML.
Oxygen allows you to capture multiple outputs. While executing XSLT stylesheets, the debugger will capture the output of xsl:result-document and present it in a view inside Oxygen.